How can you organise performance indicators in the company?
The use of Visual Management, also known as Shopfloor Management, is an essential part of Lean principles. Thanks to visual indicator management, you can clearly present all key figures to employees or customers of your company. Simple tools to view problem areas in order to improve a company’s performance step-by-step and across the company. The objective of Digital Visual Management is to simplify traditional Visual Management. This means that various working processes change and can be improved:
- You have less distance to travel to manage boards or meetings
- All results and action plans are linked
- Document processing time is shortened
- You waste less paper
- You can also organise your morning working meetings with short videos or PowerPoint presentations using the screens
Effective organisation: a pre-requisite for a progress strategy
A question which is asked by all companies: what is company efficiency?
It is based on an organisation’s ability to know that when we compare 2 businesses, the walls are purchased, the machines are purchased, skills are purchased (diplomas) – the only thing that is not purchased is organisation. If we compare two companies with the same elements at the outset, organisation will make the difference.
Strategic efficiency is management’s vision, management’s commitment to implement LEAN Manufacturing approaches (5S, TPM). Human efficacy is based on motivation, skills (through training) and communication (through visual management). If employees are motivated and competent but there is no communication, this essential element will be missing for optimum efficiency. That is why it is important to establish uniform understanding. As a result, all sectors and services must be trained in LEAN methods. Using our “Visual Management” learning simulation, you can train everyone at your company in the basics of Visual Management.
Employees’ involvement in key figures is an important aspect. This is because you identify with the key figures and automatically start to make step-by-step improvements.
How to organise the collection of information at all levels of the company
A factory is often made up of different sectors/departments, and these different sectors are often broken down into units/autonomous teams or production lines, plus the administrative part/method part/logistics/maintenance, etc.
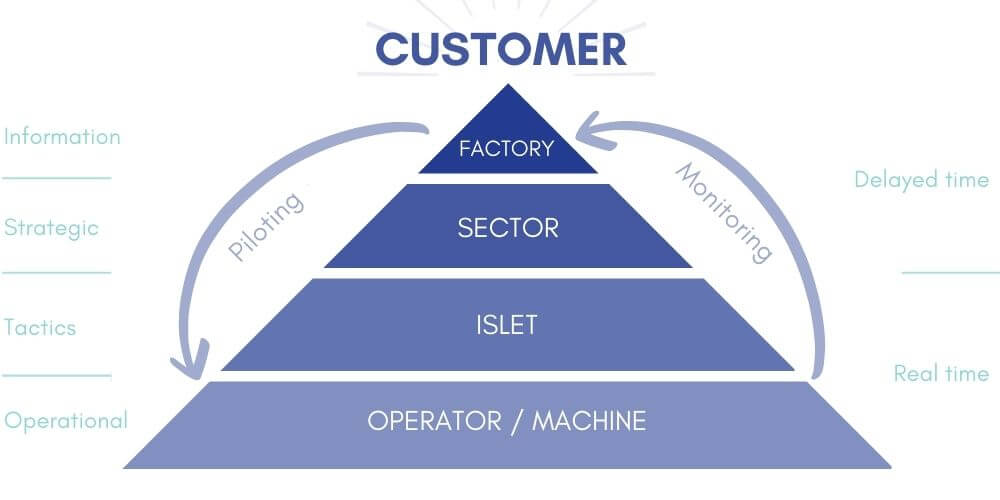 This is an organisation which is found in nearly every company. There are 4 levels, the purpose is to serve the customer, a process to get everything to work, which will include management information (e.g. number of parts to produce), a certain amount of different types of information:
- Strategic at management level
- Tactical at production manager level
- Operational at operator level
- As a result, monitoring information given in real-time by operators
What is the process to implement a communication strategy?
Workstation/machine: The workstation (or machine) is where a person works. This space is carefully organised to be safe, functional and appealing.
We collect hourly information using a workstation, a quality point or a scoreboard (like in the car industry, where operators note production levels on an hourly basis, and if after 2 or 3 hours there is a difference, the situation can be resolved).
Production units: The production unit (line, cell) is a space with similar industrial features. It is a workspace for one or several production teams. The number of teams working in the same unit depends on the zone changeover model.
Daily information is displayed here (such as 5-minute morning meetings: TOP 5’), the aim being to review the results from the previous day and the day’s objectives.
Sector: the production zone combines several production units, which together create connected industrial output.
Here we display information as weekly reviews (like Monday morning meetings) with results displayed from the previous week and the week’s objective.
The company/Management: The company coordinates industrial activities distributed across production zones with administrative and technical functions, such as human resources, business management, purchases, etc.
It displays monthly information which will be dedicated to an indicator summary and other company information like purchases/human resources/customers/processes in an optimised space for ease-of-use (with drinks machine/cafeteria table).
The objective when implementing these tools is the effectiveness of communication with this loop, as if monitoring information is incorrect, management information will also be incorrect. To progress, we must already be able to measure an initial status and track these indicators over time. (e.g. Car at Valeo, impossible to start a day if the points are not complete before starting the day.
What is the objective of this Visual Management strategy?
Depending on the pyramid, employees record their results every hour (production, interventions, rejections, etc.) Discrepancies are easier to identify and can be corrected immediately. Each day, the TEAM LEADER organises a meeting (Top 5’). The results from the previous day are reviewed. The working day is organised depending on these results. Department leaders organise a meeting on Monday morning and review figures from the previous week. Finally, the dashboard is updated each month and discussed by management. This helps verify that the results meet requirements and to decide new measures to be implemented if needed.
At all levels, they can map calendar models, action plans, indicators and various other pre-defined materials. They can also help employees to improve their skills by using quick training modules. For example, our ready-to-use training module includes all simple modules which can be accessed just by pressing a button.
Digital presentation and indicators
Here you can see an example of the “SQCDP” display with our SESAHUB software. SQCDP means:
- S – Safety
- Q – Quality
- C – Cost
- D – Delivery
- P – People
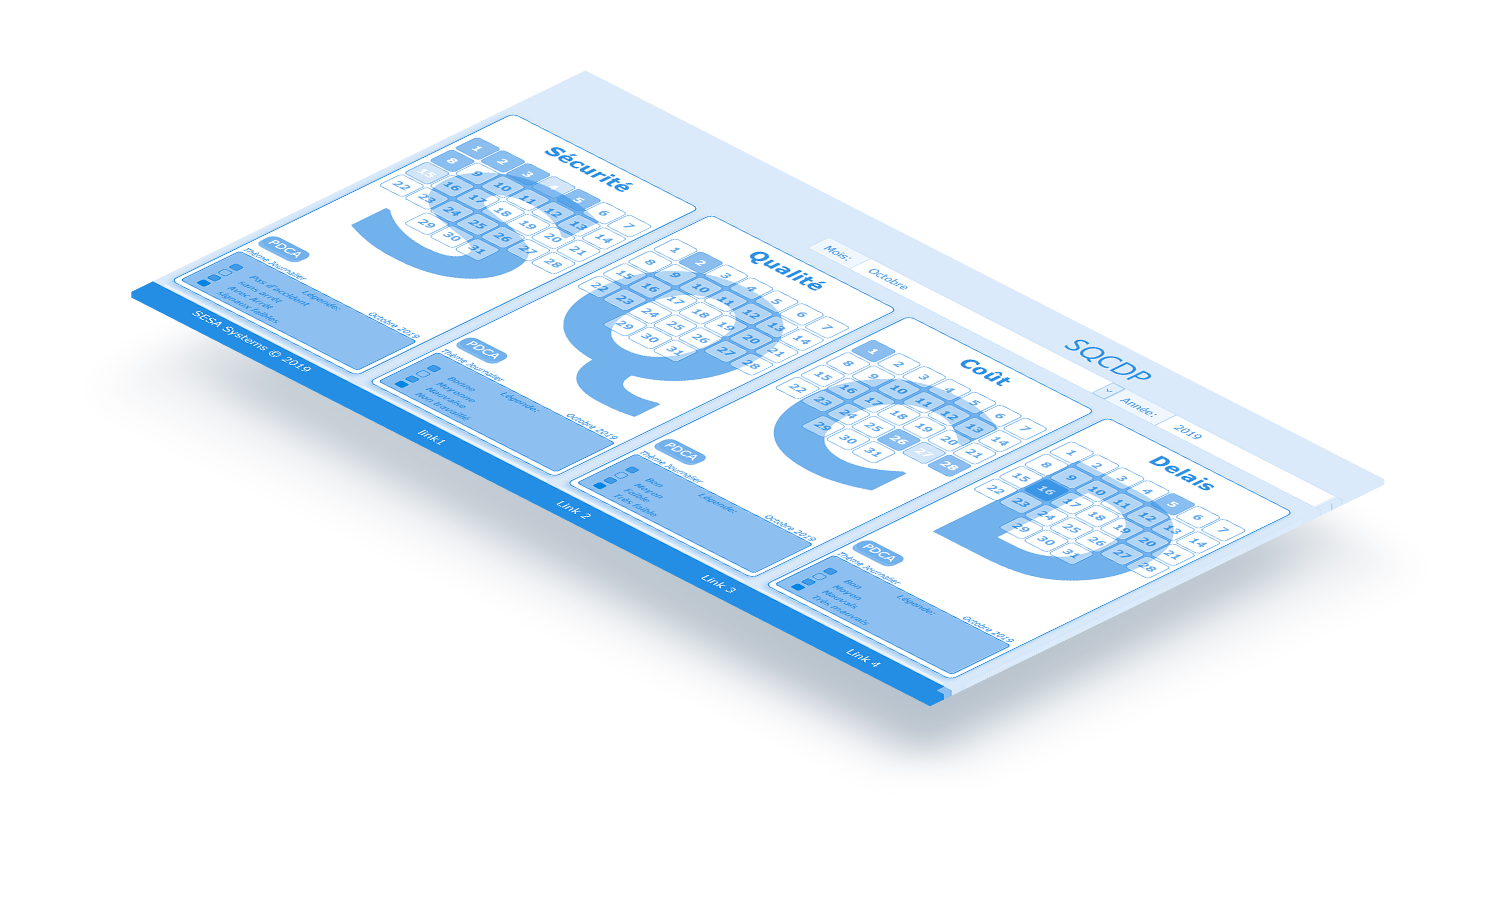
With a digital tool like this, all work flows can be coordinated simultaneously. Data collection is displayed in real time. It is also used to view production monitoring indicators. You are free to decide what you want to show. Our SESAHUB software even allows Plug and Play without significant setup.