Digital visual management

Visual management is a set of communication techniques based on sight. This method facilitates the transmission of information to enable anyone in a work area to determine whether the situation is normal or abnormal. Thanks to this, it is possible to identify anomalies and check whether operators are addressing these issues. Thus, visual management aims to quickly visualize the relevant indicators of a department or workshop to effectively manage various activities.
This method is used in the Toyota Production System and can be found across a variety of Lean tools. For example, Kanban, Six Sigma, and PDCA rely on visual management. This approach promotes close management, as it enhances involvement by leveraging sight, knowledge, and action.
Once implemented, the goal of visual management is to make decisions more quickly, facilitate internal communication, and accelerate the flow of information. For example, in industry, visual management can be used to communicate safety instructions. This method aligns with the Lean mindset, as the objective is to continuously improve performance using indicators.
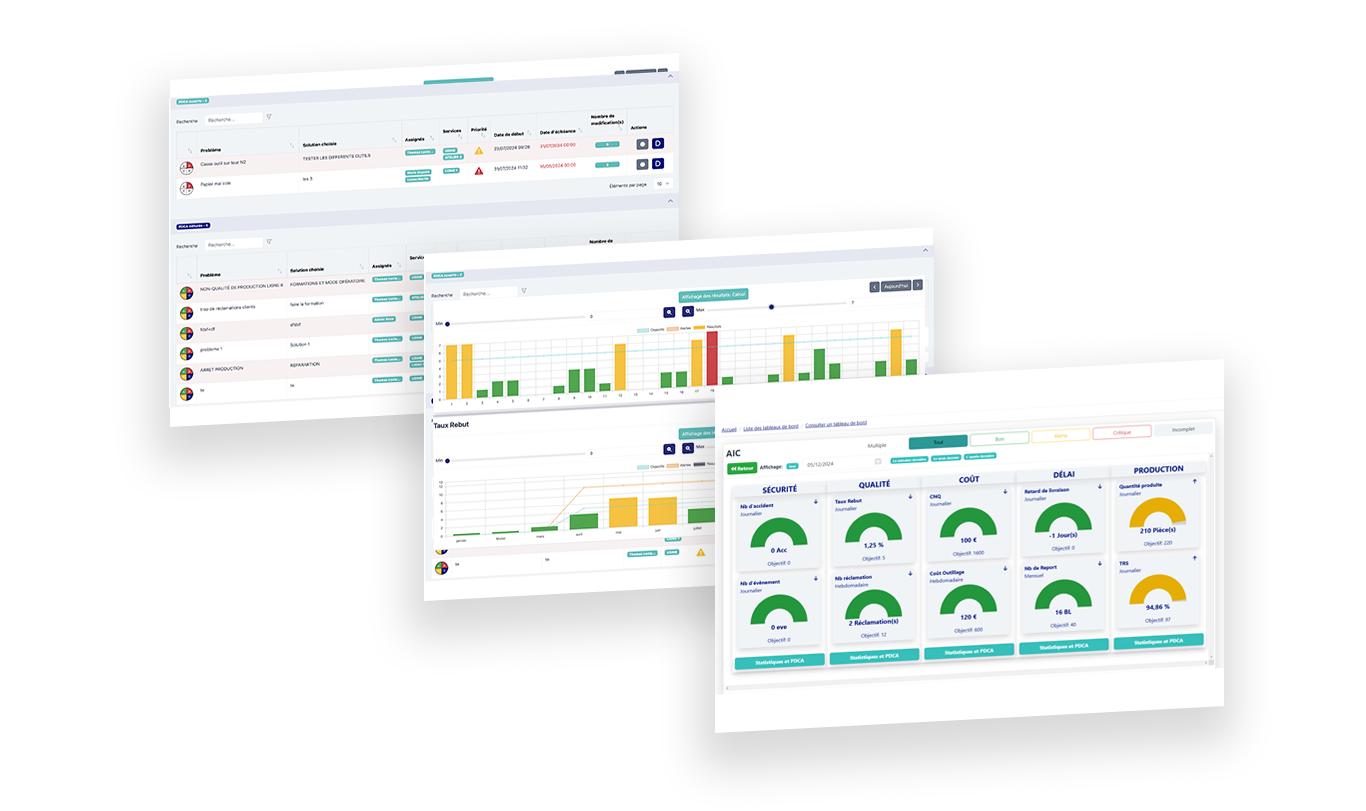
A KPI, or Key Performance Indicator in English, is a key performance indicator. The goal is simple: to continuously measure important company data. As a result, this measurement provides statistics on the company's progress or the objectives to be achieved. Conversely, if the figure declines, performance indicators help guide the necessary actions to be taken.
These KPIs should be easily accessible and visible to everyone. Therefore, they are widely used in visual management to guide managers in their action plans. They are displayed on display boards to facilitate monitoring.